
Page 17 - BRIP ePoster Book
P. 17
DETERMINANTS OF TECHNICAL EFFICIENCY OF PUBLIC DISTRICT HOSPITALS IN KWAZULU-NATAL
PROVINCE, SOUTH AFRICA
Tesleem K. Babalola; Indres Moodley [Department of Public Health, School of Nursing and Public Health, College of Health Sciences, University of KwaZulu-Natal, South Africa.]
Background Results
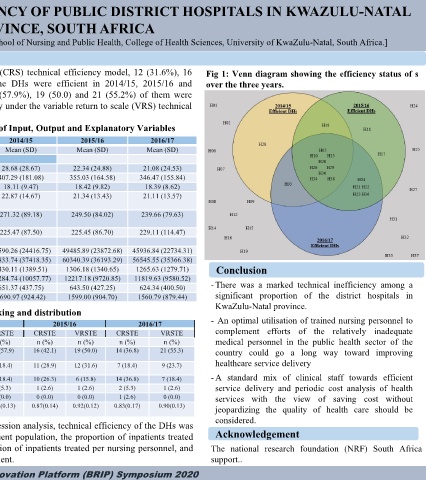
- South Africa health care system is majorly dominated by the public Based on constant return scale (CRS) technical efficiency model, 12 (31.6%), 16 Fig 1: Venn diagram showing the efficiency status of s
sector, a rapidly-growing private and emerging NGO sector. (42.1%) and 14 (36.8%) of the DHs were efficient in 2014/15, 2015/16 and over the three years.
- The country’s high disease prevalence (such as the HIV/AIDS and 2016/17 respectively while 22 (57.9%), 19 (50.0) and 21 (55.2%) of them were
Tuberculosis) complicated by high poverty and unemployment rate efficient in the years respectively under the variable return to scale (VRS) technical
makes provision of healthcare for majority of the population a efficiency model.
responsibility of the government. Table 1: Descriptive statistics of Input, Output and Explanatory Variables
2015/16
2014/15
2016/17
- The majority of South Africans access health care services through the Variables Mean (SD) Mean (SD) Mean (SD)
public sector district health system. Input variables
- The public health sector consumes around 9% of the total government Medical and Dental Personnel 28.68 (28.67) 22.34 (24.88) 21.08 (24.53)
budget, a value higher than the 5% of GDP recommended by the WHO. Nursing Personnel 407.29 (181.08) 355.03 (164.58) 346.47 (155.84)
18.42 (9.82)
18.11 (9.47)
Pharmacy Personnel
18.39 (8.62)
- Districts hospitals (DHs) account for 64% of public hospitals in the Allied Personnel (Therapists & 22.87 (14.67) 21.34 (13.43) 21.11 (13.57)
country and consumed more than half (55%) of the government's total Lab. scientists)
hospital budget. Support & other services 271.32 (89.18) 249.50 (84.02) 239.66 (79.63)
personnel
Beds
- DHs play an essential role in supporting PHC on the one hand and the Output variables 225.47 (87.50) 225.45 (86.70) 229.11 (114.47)
other as a gateway to more specialist care. Inpatient days 51590.26 (24416.75) 49485.89 (23872.68) 45936.84 (22734.31)
OPD Head counts 62833.74 (37418.35) 60340.39 (36193.29) 56545.55 (35366.38)
- Given the enormous task assigned to the public district hospitals within Theatre cases 1430.11 (1389.51) 1306.18 (1340.65) 1265.63 (1279.71) Conclusion
the country, this study aimed at examining factors influencing their X-ray done 12284.74 (10057.77) 12217.18 (9720.85) 11819.63 (9580.52)
technical efficiency. Delivery by caesarean 651.37 (437.75) 643.50 (427.25) 624.34 (400.50) -There was a marked technical inefficiency among a
Methodology Regular Delivery 1690.97 (924.42) 1599.00 (904.70) 1560.79 (879.44) significant proportion of the district hospitals in
KwaZulu-Natal province.
- All the total thirty-eight district hospitals from the eleven districts in Table 2: District hospitals ranking and distribution
the province were included in the study. 2014/15 2015/16 2016/17 - An optimal utilisation of trained nursing personnel to
CRSTE VRSTE CRSTE VRSTE CRSTE VRSTE complement efforts of the relatively inadequate
- Data on Input resources such as medical personnel, output DH ranking n (%) n (%) n (%) n (%) n (%) n (%) medical personnel in the public health sector of the
information such as outpatient visits, and other exploratory variables 100% 12 (31.6) 22 (57.9) 16 (42.1) 19 (50.0) 14 (36.8) 21 (55.3) country could go a long way toward improving
were retrieved from the databases of the district health information 80.0 – 99.9% 12 (31.6) 7 (18.4) 11 (28.9) 12 (31.6) 7 (18.4) 9 (23.7) healthcare service delivery
system (DHIS), basic accounting system (BAS) of the national 60.0 – 79.9% 12 (31.6) 7 (18.4) 10 (26.3) 6 (15.8) 14 (36.8) 7 (18.4) -A standard mix of clinical staff towards efficient
treasury, and personnel and salary systems (PERSAL) for three 40.0 – 59.9% 2 (5.3) 2 (5.3) 1 (2.6) 1 (2.6) 2 (5.3) 1 (2.6) service delivery and periodic cost analysis of health
consecutive years (2014/15, 2015/16 and 2016/17). < 40.0% 0 (0.0) 0 (0.0) 0 (0.0) 0 (0.0) 1 (2.6) 0 (0.0) services with the view of saving cost without
- This study utilized the data envelopment analysis (DEA) approach in Mean 0.85(0.14) 0.91(0.13) 0.87(0.14) 0.92(0.12) 0.83(0.17) 0.90(0.13) jeopardizing the quality of health care should be
the assessing the technical efficiency of the DHs based on both - Based on binomial multiple regression analysis, technical efficiency of the DHs was considered.
constant and variable returns to scale (CRS & VRS) models. found to be influenced by; catchment population, the proportion of inpatients treated Acknowledgement
- A regression model analysis was used to determine factors per medical personnel, the proportion of inpatients treated per nursing personnel, and The national research foundation (NRF) South Africa
influencing the TE of the district hospitals expenditure per patient day equivalent. support..
10th Annual Biomedical Research & Innovation Platform (BRIP) Symposium 2020