
Page 68 - SAMRC Annual Performance Plan 2026-27
P. 68
PART C: MEASURING SAMRC PERFORMANCE
continued
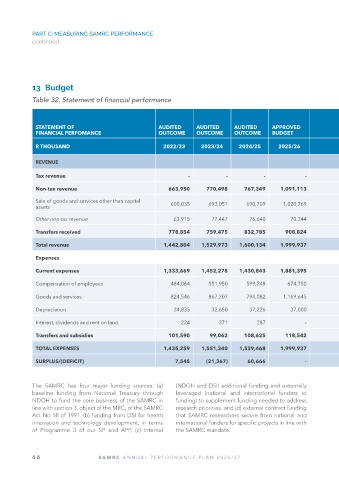
13 Budget
Table 32. Statement of financial performance
AVERAGE AVERAGE EXPENDITURE/
GROWTH EXPENDITURE/ ROWTH TOTAL:
STATEMENT OF AUDITED AUDITED AUDITED APPROVED RATE TOTAL: AVERAGE RATE AVERAGE
FINANCIAL PERFOMANCE OUTCOME OUTCOME OUTCOME BUDGET (%) (%) MEDIUM-TERM ESTIMATE (%) (%)
R THOUSAND 2022/23 2023/24 2024/25 2025/26 2022/23-2025/26 2026/27 2027/28 2028/29 2025/26 - 2028/29
REVENUE
Tax revenue - - - - - - - - - - -
Non-tax revenue 663,950 770,498 767,349 1,091,113 18.0% 49.7% 1,167,491 1,249,215 1,372,423 7.9% 56.1%
Sale of goods and services other than capital 19.4%
assets 600,035 693,051 690,709 1,020,769 45.3% 1,095,338 1,175,757 1,292,423 8.2% 52.7%
Other non-tax revenue 63,915 77,447 76,640 70,344 3.2% 4.4% 72,153 73,458 80,000 4.4% 3.4%
Transfers received 778,854 759,475 832,785 908,824 5.3% 50.3% 936,984 979,148 979,148 2.5% 43.9%
Total revenue 1,442,804 1,529,973 1,600,134 1,999,937 11.5% 100.0% 2,104,475 2,228,363 2,351,571 5.5% 100.0%
Expenses
Current expenses 1,333,669 1,452,278 1,430,843 1,881,395 12.2% 100.0% 1,982,260 2,100,622 2,223,830 5.7% 94.3%
Compensation of employees 484,064 551,950 599,248 674,750 11.7% 35.5% 715,235 758,149 796,056 5.7% 33.9%
Goods and services 824,546 867,307 794,082 1,169,645 12.4% 55.9% 1,229,030 1,303,966 1,385,416 5.8% 58.6%
Depreciation 24,835 32,650 37,226 37,000 14.2% 2.0% 37,995 38,507 42,358 4.6% 1.8%
Interest, dividends and rent on land 224 371 287 – 100.0% - - - - - -
Transfers and subsidies 101,590 99,062 108,625 118,542 5.3% 6.6% 122,215 127,741 127,741 2.5% 5.7%
TOTAL EXPENSES 1,435,259 1,551,340 1,539,468 1,999,937 11.7% 100.0% 2,104,475 2,228,363 2,351,571 5.5% 100.0%
SURPLUS/(DEFICIT) 7,545 (21,367) 60,666 - 100.0% - - - - -
The SAMRC has four major funding sources: (a) (NDOH and DSI) additional funding and externally
baseline funding from National Treasury through leveraged (national and international funders to
NDOH to fund the core business of the SAMRC in funding) to supplement funding needed to address
line with section 3, object of the MRC, of the SAMRC research priorities, and (d) external contract funding
Act No 58 of 1991. (b) funding from DSI for health that SAMRC researchers secure from national and
innovation and technology development, in terms international funders for specific projects in line with
of Programme 3 of our SP and APP, (c) Internal the SAMRC mandate.
66 SAMRC ANNUAL PERFORMANCE PLAN 2026/27