Page 49 - SAMRC Strategic Plan
P. 49

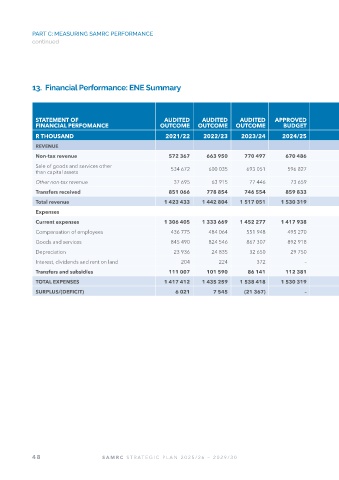
PART C: MEASURING SAMRC PERFORMANCE
            continued


            13.  Financial Performance: ENE Summary


                                                                                                                                     AVERAGE     EXPENDITURE/                                           AVERAGE     EXPENDITURE/
                                                                                                                                     GROWTH              TOTAL:                                          ROWTH              TOTAL:
              STATEMENT OF                                 AUDITED      AUDITED      AUDITED      APPROVED                               RATE         AVERAGE                                               RATE         AVERAGE
              FINANCIAL PERFOMANCE                       OUTCOME       OUTCOME      OUTCOME         BUDGET                                 (%)               (%)           MEDIUM-TERM ESTIMATE              (%)               (%)
              R THOUSAND                                   2021/22      2022/23       2023/24       2024/25                                  2021/22 – 2024/25     2025/26     2026/27      2027/28             2024/25 – 2027/28

              REVENUE
              Non-tax revenue                               572 367       663 950      770 497       670 486                              5.4%            45.2%    1 091 113   1 167 491   1 249 215       23.1%             52.5%
              Sale of goods and services other                                                                                            3.7%             41.0%    1 010 269   1 080 988   1 156 657       24.7%            48.3%
              than capital assets                            534 672      600 035       693 051       596 827

              Other non-tax revenue                           37 695       63 915        77 446        73 659                            25.0%              4.2%      80 844      86 503      92 558         7.9%              4.3%
              Transfers received                            851 066       778 854      746 554       859 833                              0.3%            54.8%     898 824      936 984     979 355        4.4%             47.5%
              Total revenue                                1 423 433    1 442 804    1 517 051      1 530 319                             2.4%           100.0%    1 989 937   2 104 475   2 228 570       13.3%            100.0%
              Expenses
              Current expenses                             1 306 405    1 333 669    1 452 277      1 417 938                             2.8%           100.0%    1 872 699   1 982 260   2 100 828       14.0%             93.8%
              Compensation of employees                      436 775      484 064       551 948       495 270                             4.3%             33.2%     547 830     566 402     588 339         5.9%            28.3%

              Goods and services                             845 490      824 546       867 307       892 918                             1.8%             58.0%    1 287 869   1 377 863   1 473 982       18.2%            63.7%
              Depreciation                                    23 936       24 835        32 650        29 750                             7.5%              1.9%      37 000      37 995      38 507         9.0%              1.8%
              Interest, dividends and rent on land               204          224           372             –                           -100.0%                –           –           –           –            –                 –
              Transfers and subsidies                       111 007       101 590       86 141       112 381                              0.4%             7.0%     117 238      122 215     127 742        4.4%              6.2%
              TOTAL EXPENSES                               1 417 412    1 435 259    1 538 418      1 530 319                             2.6%           100.0%    1 989 937   2 104 475   2 228 570       13.3%            100.0%

              SURPLUS/(DEFICIT)                                6 021        7 545      (21 367)             –                          -100.0%                             –           –           –


            48                       SAMRC   STRATEGIC PLAN 2025/26 – 2029/30
   44   45   46   47   48   49   50   51   52   53   54