
Page 111 - SAMRC Annual Report 2024-2025
P. 111
PERFORMANCE INFORMATION
data dashboards that transform complex datasets The Unit's SAFOODS division proudly showcased its
into compelling narratives. These dashboards use work as exhibitors at the biennial National Nutrition
dynamic visualisations, such as graphs, heatmaps, Congress in Durban during October 2024. The 2024
and trend analyses, to illustrate key insights in an updated food composition tables and food quantities
engaging and accessible manner. By incorporating manual E-publications, and new data cleaning and
user-friendly interfaces and real-time data updates, coding services, were showcased. DIASA, our 24hr
we enable stakeholders-from policymakers to recall mobile app, and D-GenUs. an expert working
community members to explore findings intuitively and advisory group of food composition data
and draw meaningful conclusions. Feedback from generators and users, were also launched at the
these engagements has been overwhelmingly Congress. As part of an interaction, a fun activity to
positive, with users highlighting how the visual showcase our work, our services and products were
storytelling approach enhances understanding compiled in a Spin the Wheel quiz and giveaways
and decision-making. This artistic fusion of data to congress delegates. The exhibition generated a
and design not only improves accessibility but also high degree of interest and has resulted in numerous
fosters deeper engagement with our research. post-conference interactions and requests.
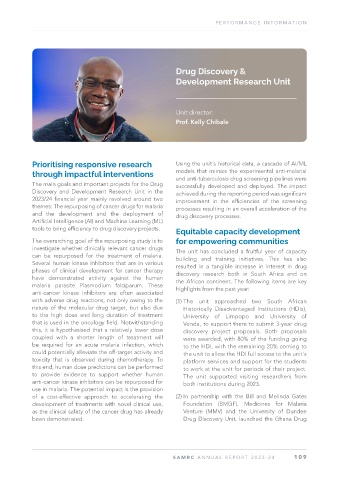
SAFOODS team, exhibiting at the National Nutrition Congress.
SAMRC ANNUAL REPOR T 2024-25 109